
Fitting a Network TAP to our Inference Verification Prototype
Passively capturing inference traffic from an optical TAP, reconstructing it, and checking that nothing else crosses the link.
Contents
Background
We aim to demonstrate the feasibility of tapping the network to access inference events, rather than relying on an honest prover to forward the data as in our initial testing.
If you haven’t read it already, we recommend reading our previous article on scaling the inference prototype.
Including the network TAP is a key step towards building a Plan A-compatible prototype.
Overview of the target system
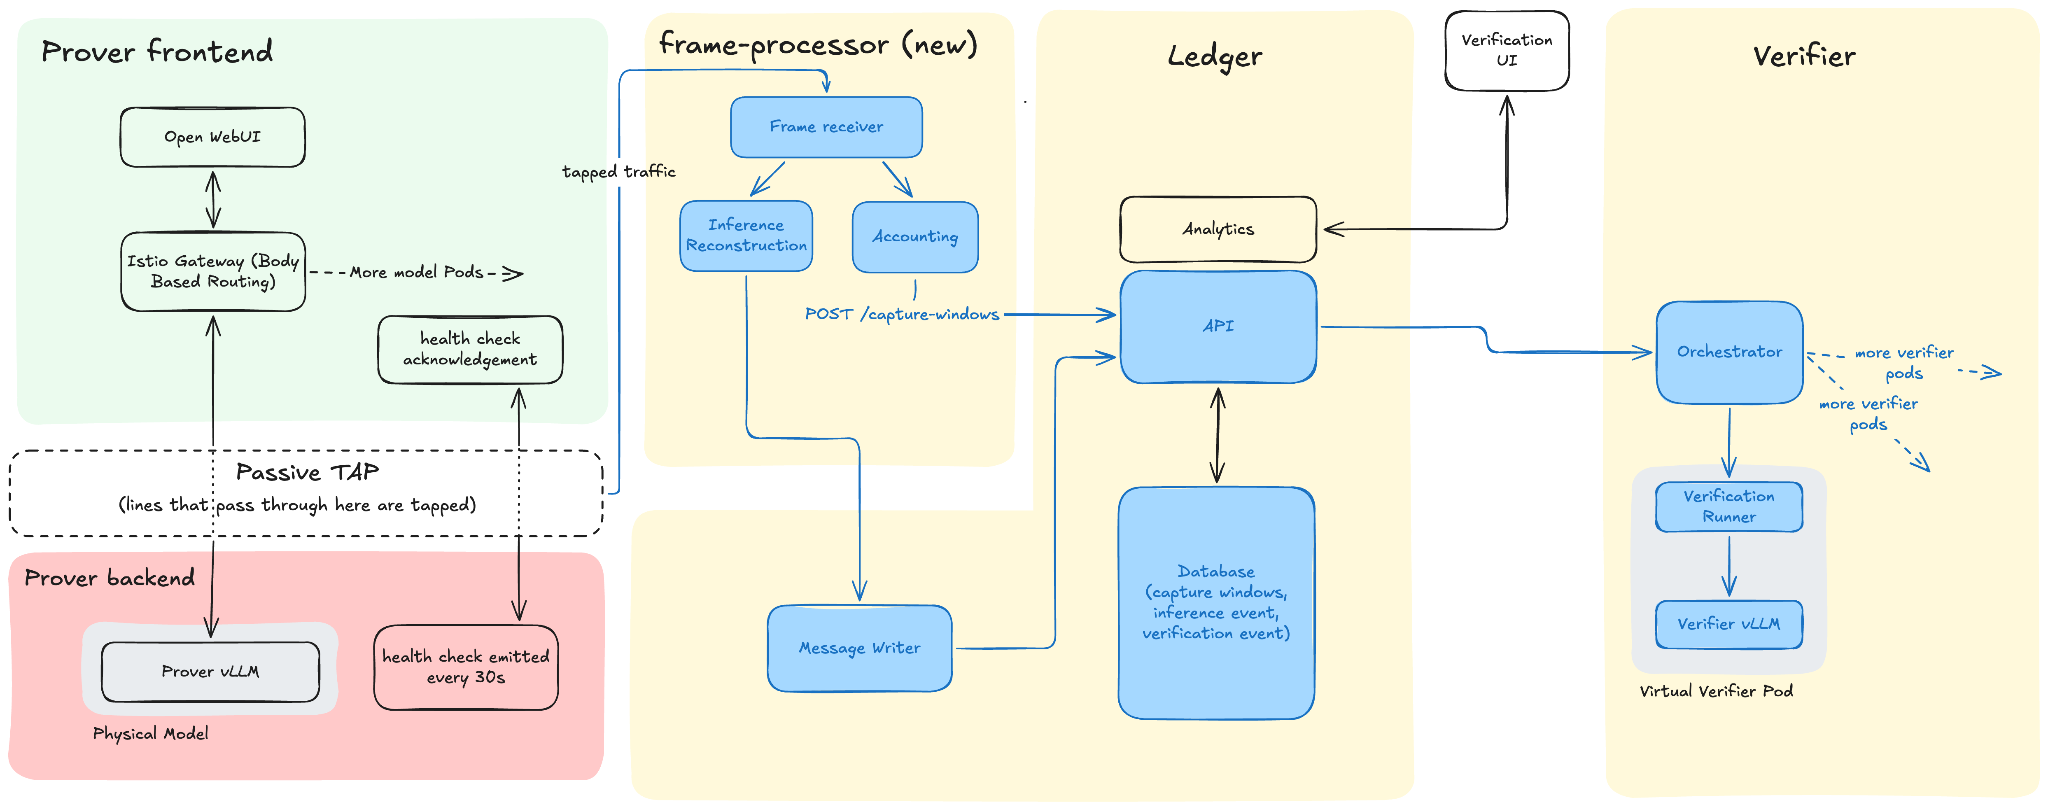
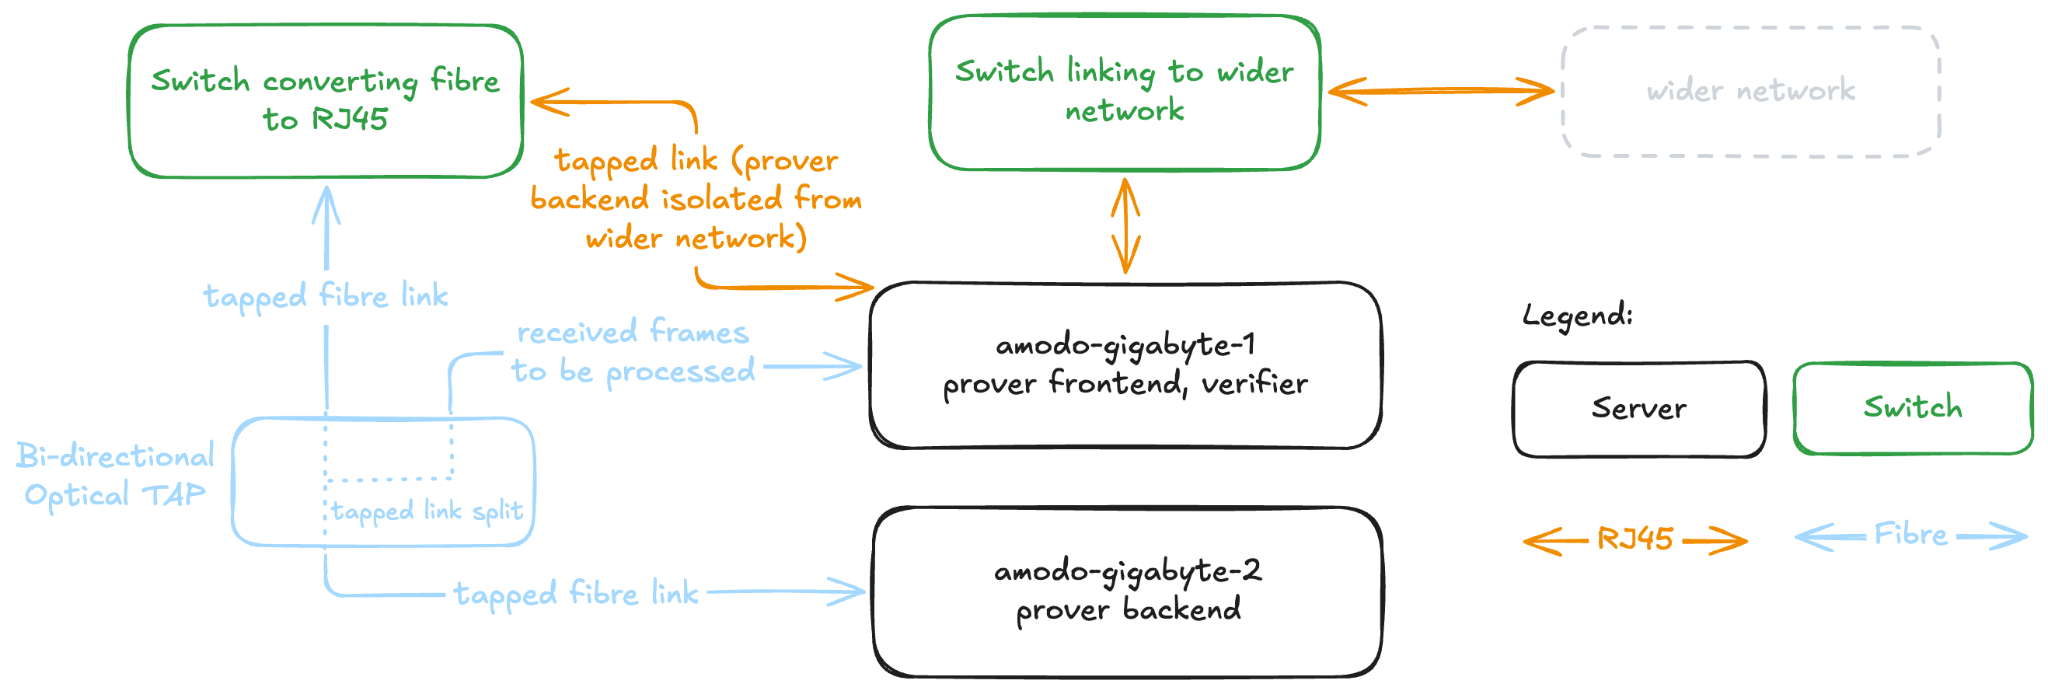
The prover is only connected to the network via a single link, which is fitted with a passive optical network TAP. The TAP forwards all traffic to the verifier system. The verifier system:
- Recomputes inference events from reconstructed traffic provided by the frame processor to verify their correctness.
- Ensures that non-inference traffic is of a few specific allowed types, and logs/flags when it sees non-allowed traffic. By isolating the prover, we can check against a whitelist of traffic that may cross the TAP, and raise an alarm and store an account of any disallowed traffic.
A compliant prover is only allowed to:
- Serve legitimate inference requests.
- Send periodic health checks:
- A passive TAP cannot distinguish a quiet link from a dead one. We force the prover to emit a health check every 30 s (±5 s). Failing to meet this condition is also disallowed.
- Perform some simple network operations, e.g. ARP (Address Resolution Protocol) requests.
Creating the compliant prover required some modifications to a regular system, including turning off some non-essential network functions, and designing the bespoke health check system.
Capturing and processing the inference traffic
We have to reconstruct inference messages from the raw frames from the TAP, to pass into the ledger. This process is not automatically handled by the OS and NIC, as we are not an active participant in the link.
Technical note: we will mention “frames” and “packets” throughout this write-up. A frame is the complete Ethernet unit that crosses the wire. A packet (e.g. ARP, IPv4, etc.) is transferred within a frame. See OSI model layers 2 and 3.
There are only certain types of traffic that are allowed, which are on a “whitelist”. These are shown in Table 1.
| Traffic | Why it is necessary |
|---|---|
| ARP (Address Resolution Protocol) | Regular network traffic used to resolve MAC addresses. As there are two links, each frame has an exact expected value. |
| Health check UDP: 9999 | The link health check shows that the prover’s system is still connected, and would eventually contain diagnostic health check information (not implemented currently). |
| Inference traffic HTTP/1.1 over TCP: 8000 | The inference traffic itself. We only permit HTTP/1.1 traffic to be transmitted within this type of frame. |
Table 1. Allowed traffic on the prover's network link.
See Whitelisted traffic details for more on each of the items on the whitelist.
We built the new software component of the verifier system (the “frame processor”) which:
- Captures the traffic off the tapped link.
- Reconstructs the frames.
- Accounts for and identifies each frame, logging an event if the frame is not whitelisted.
- Filters and forwards inference events to the message writer to be verified (already built in our previous prototype).
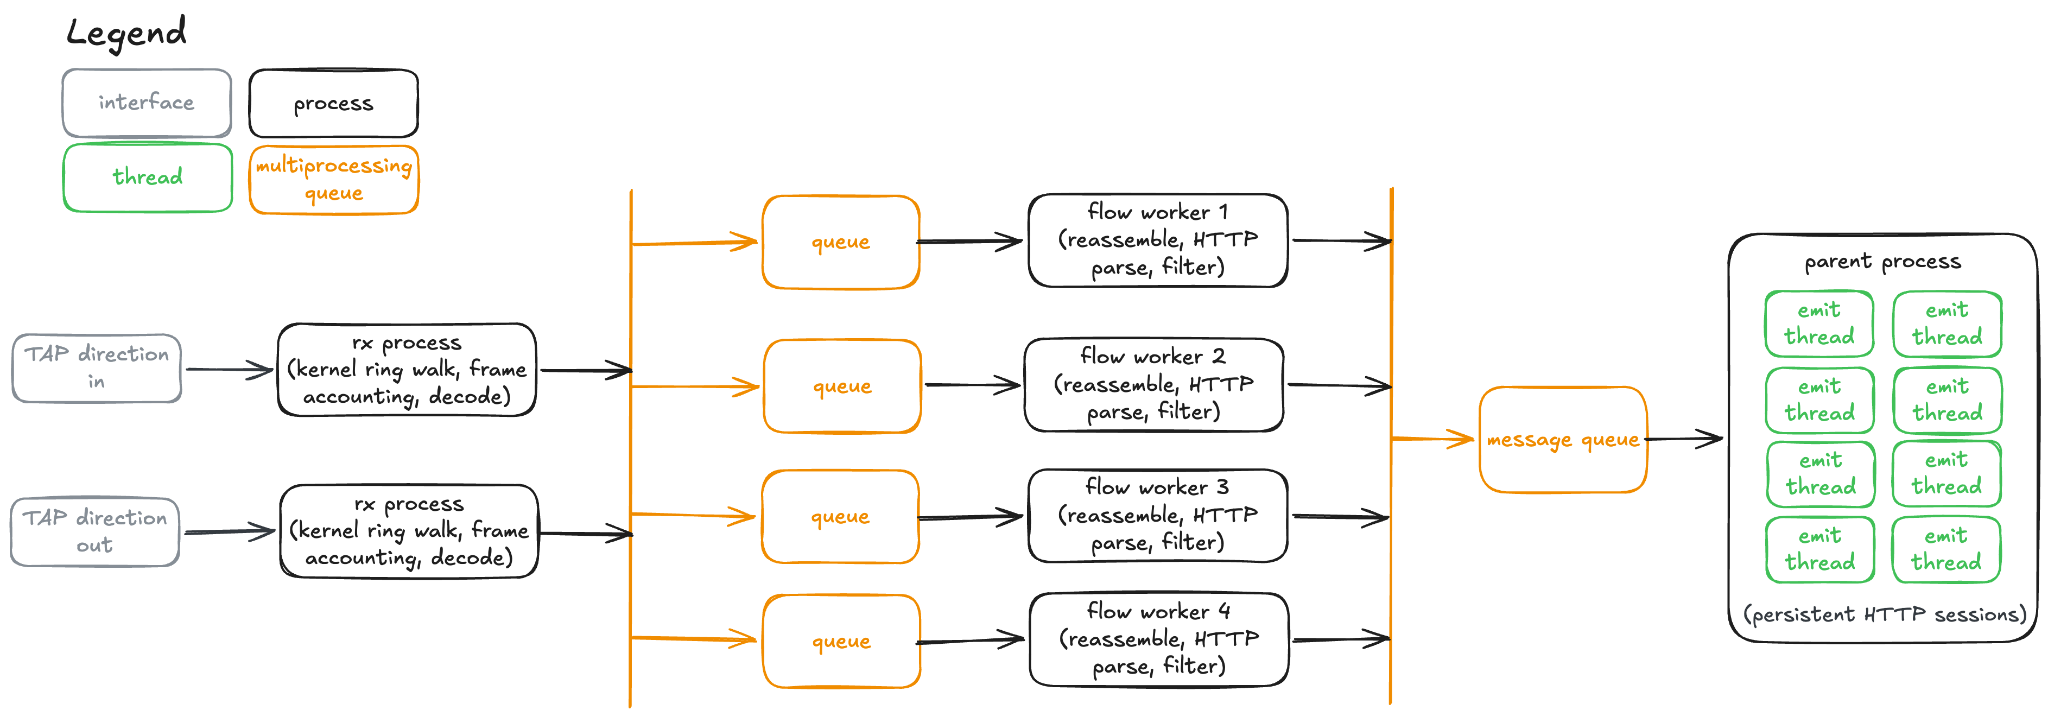
Figure 2 shows the flow of traffic through this component.
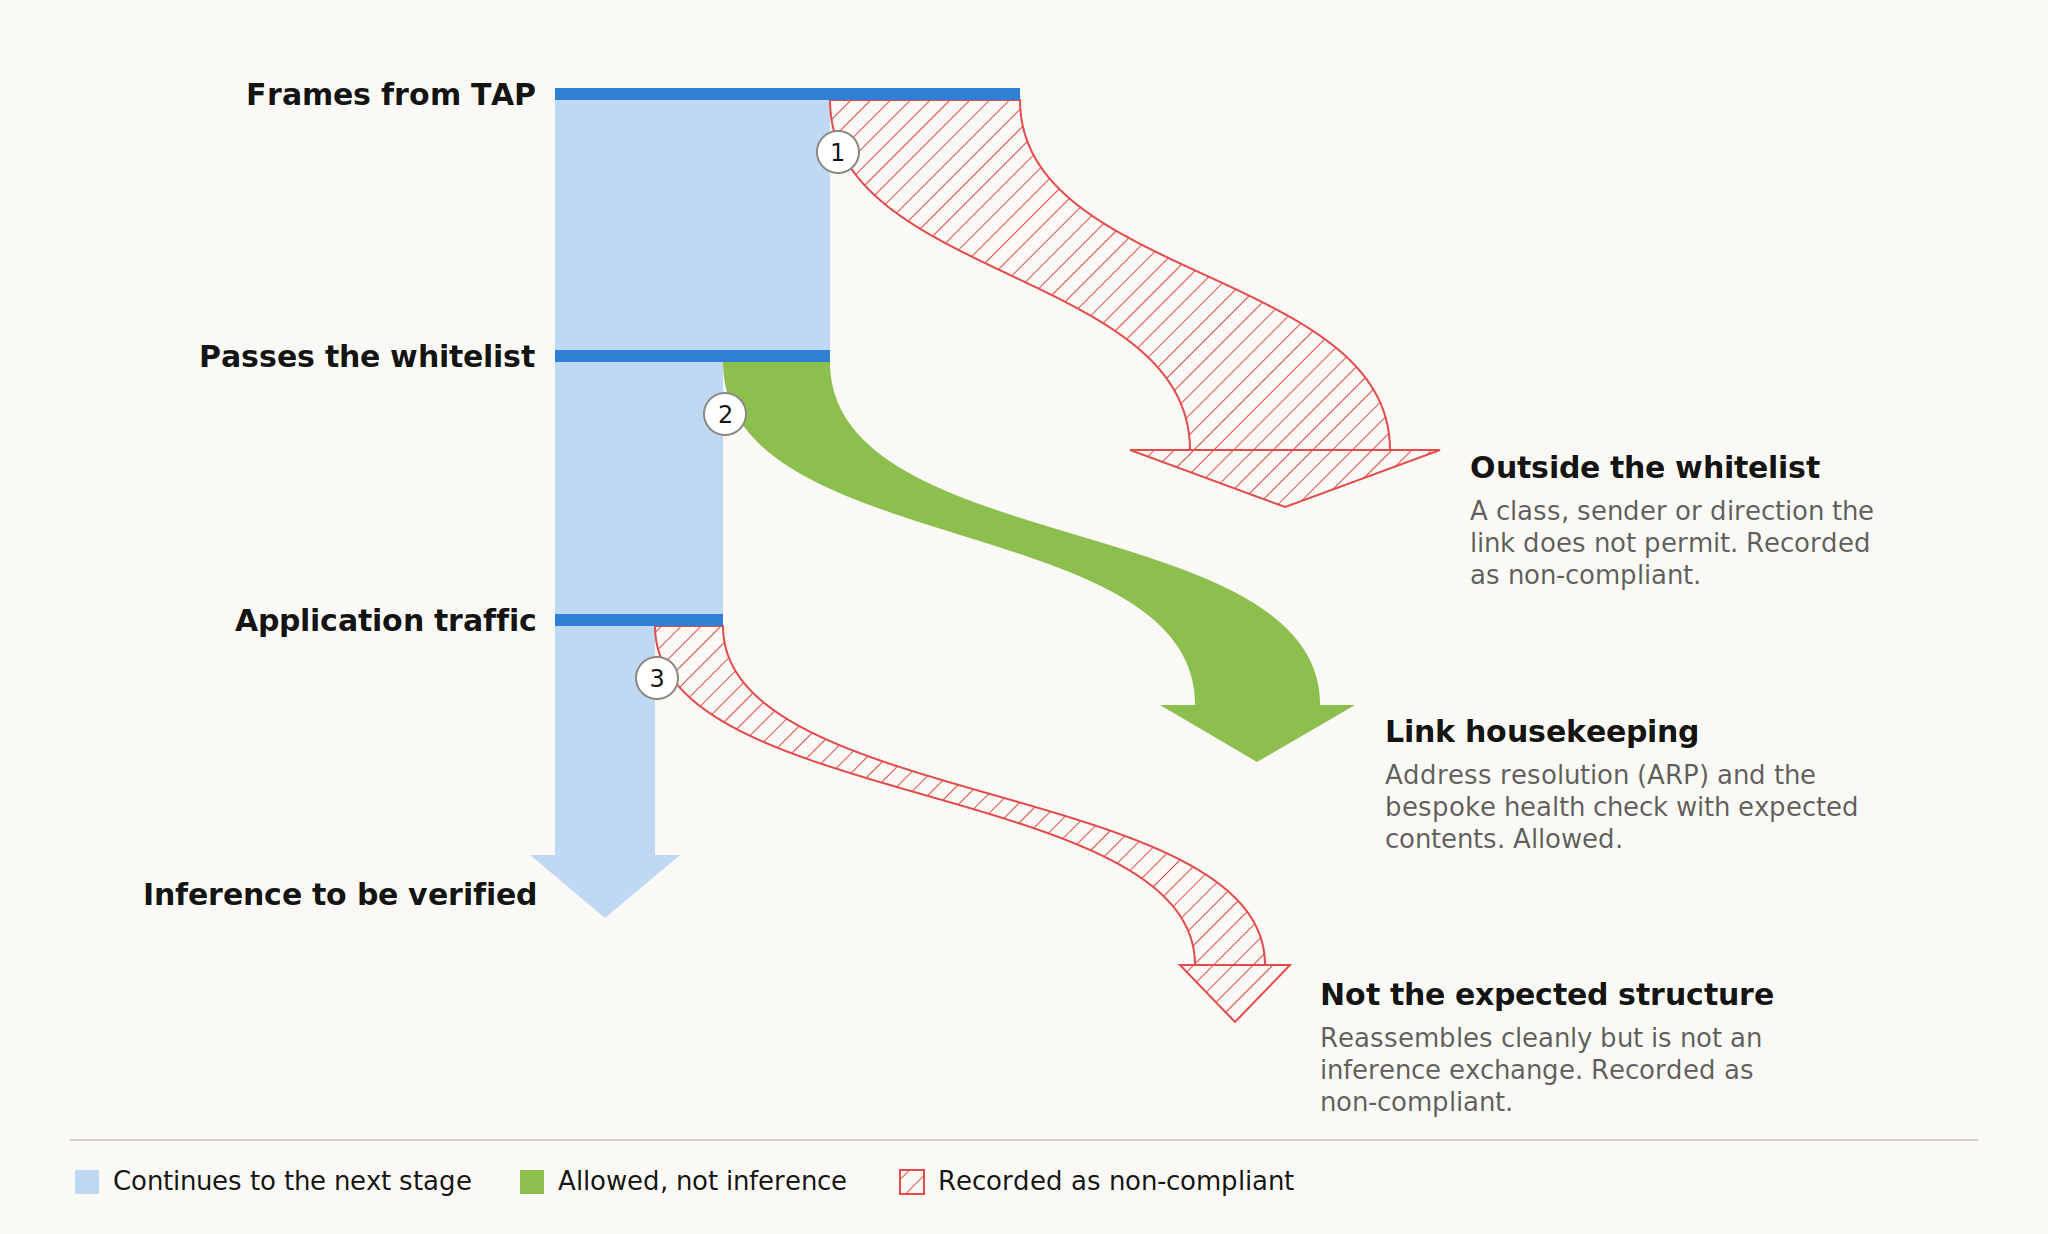
0. Capture frames from the TAP
We open a socket and read whatever data comes from the Linux kernel. We must ensure that the NIC is in promiscuous mode so that it receives Ethernet frames not directly addressed to it.
Technical note: each frame is read from a block ring (a region of shared memory between the kernel and the frame processor). This allows the kernel to provide hundreds of frames to the socket at once, which is computationally much cheaper than asking for each frame individually.
Each frame is walked header by header (Ethernet, any VLAN tags, IPv4, then TCP). Each of the checks below reads directly from the block ring that the kernel filled.
1. Is this frame in our whitelisted traffic?
The frame is not passed further if it:
- Is malformed or otherwise unparseable.
- Does not match the whitelist.
See Whitelisted traffic details for details on the whitelist.
A frame that does not match the whitelist is a “finding”, and is committed to the ledger. Findings are defined by:
- The reason why the frame was flagged (non-zero padding, disallowed type, etc.)
- The frame’s class (e.g. TCP, ARP)
- Direction (in/out)
- Who sent it (MAC address)
Multiple of the same “finding” can occur if the above properties are the same for multiple frames. See Appendix A for details on how findings are stored.
2. Which whitelist item is this frame?
We check which of the three whitelisted items the frame is, and process accordingly. ARP and health check frames are checked to be compliant (see Whitelisted traffic details). This includes ensuring timing is compliant, checking static fields are correct, etc.
Inference traffic (matching HTTP/1.1 over TCP port 8000) is passed on.
3. Is the frame part of inference traffic?
We now have all “HTTP/1.1 over TCP: 8000” traffic from header parsing. We need to reconstruct the inference requests to be passed on to the message writer, and into the ledger, to be verified.
We pull out the information necessary for reassembly, such as the source and destination ports, flags, sequence number and payload bytes.
See Inference HTTP/1.1 via TCP for details of inference request reconstruction.
Whitelisted traffic details
Table 1 above lists the three allowed types of traffic on the prover’s network link. All other traffic is classified and logged with a sample of the offending frame. To ensure a bad actor is not masquerading other traffic as whitelisted frame types, we validate the contents of a classified frame against its expected structure. See Appendix D for which fields within each frame are validated.
Other traffic we have not whitelisted may be required in a real data centre. See Appendix E for side-channel analysis of traffic not in our prototype.
Health check (UDP: 9999)
The prover’s system is required to send a periodic health check. This allows the prover to ensure their servers are still online, but the message format and timing are highly prescriptive to minimise possible side channels. This would eventually contain diagnostic health check information (not implemented currently).
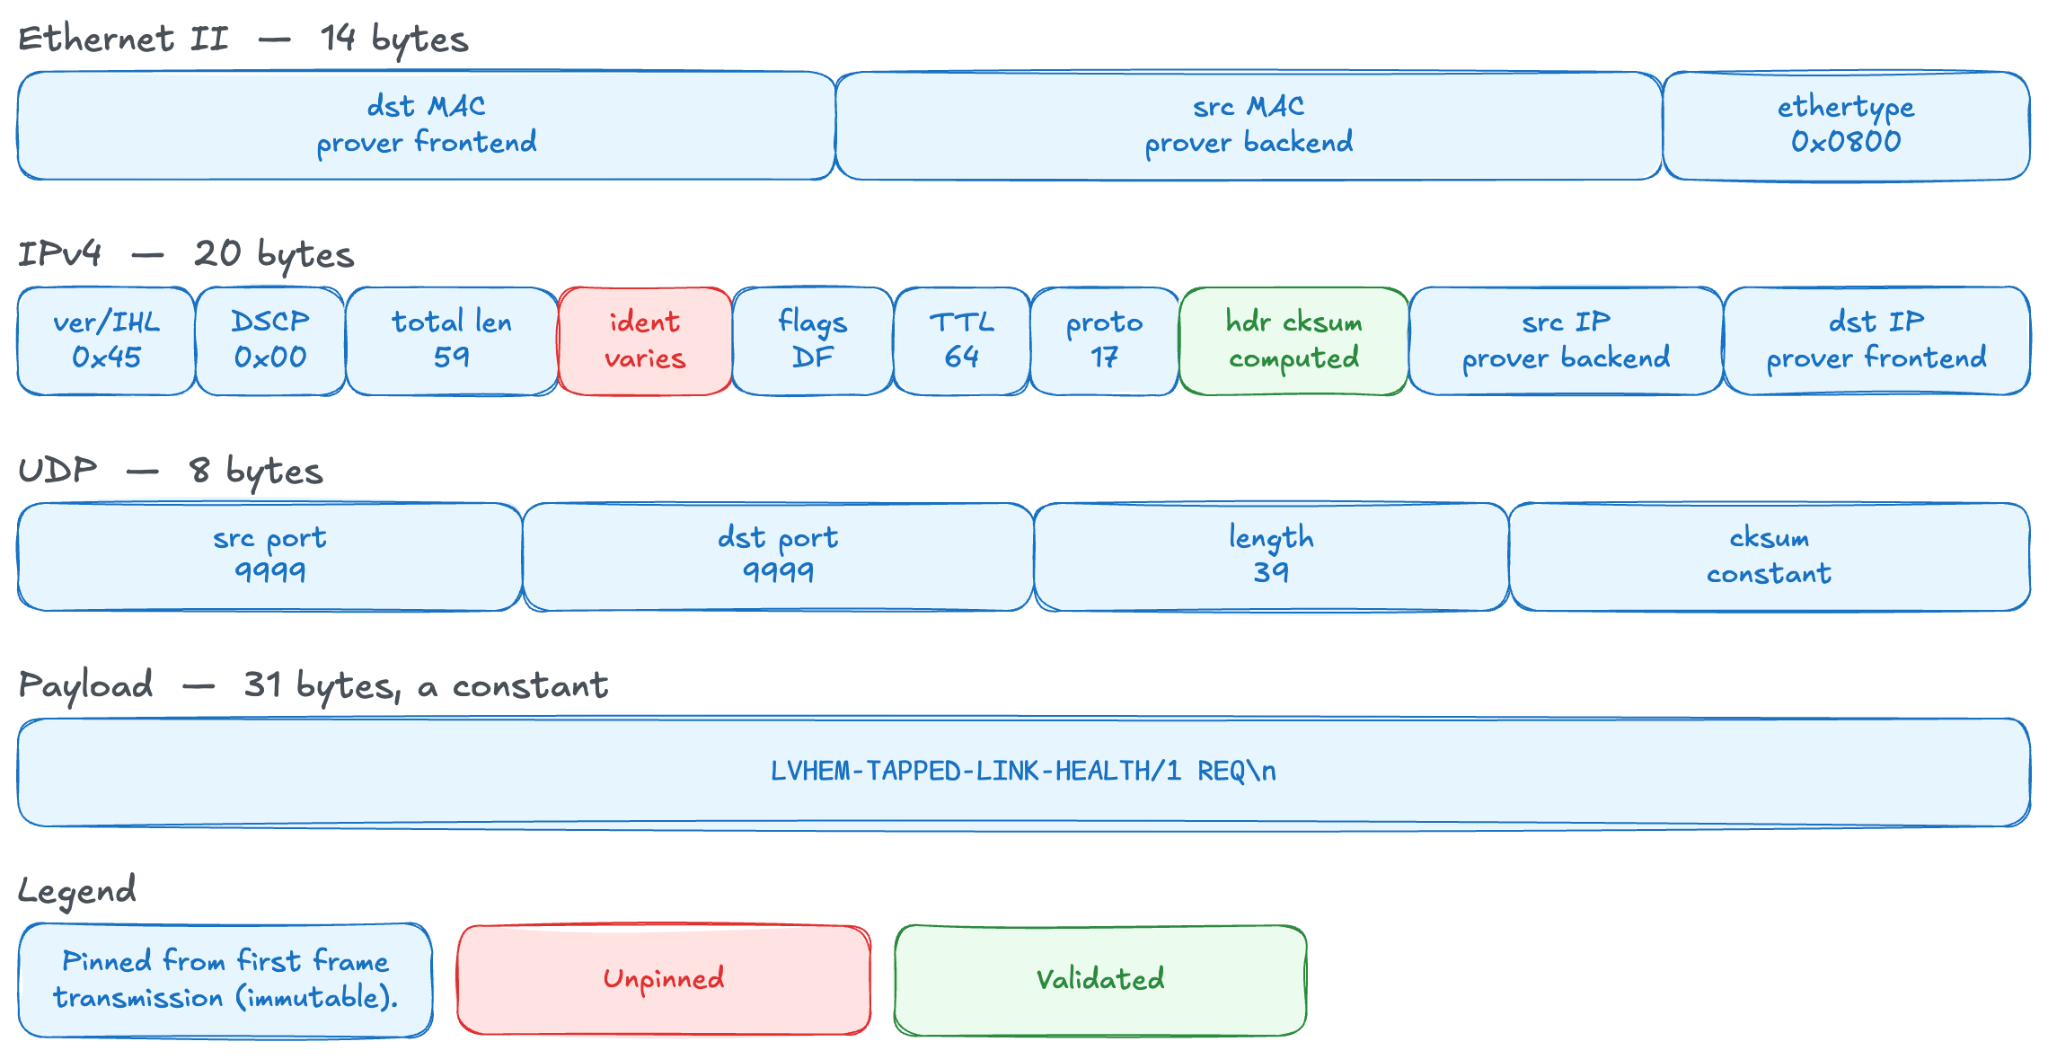
Note: here we define a “pin” as a check that this sender has sent these exact bytes before. Expected pins can be configured in advance.
This is a bespoke health check frame that we have designed to be as minimal as possible, excluding other data seen in contemporary health checks such as configuration information.
Values in most fields are the same each time and can be validated by ensuring each field is immutable. This is checked by the frame processor, which will log an event if a frame is non-compliant. This mitigates exfiltration via a health check’s payload.
ARP
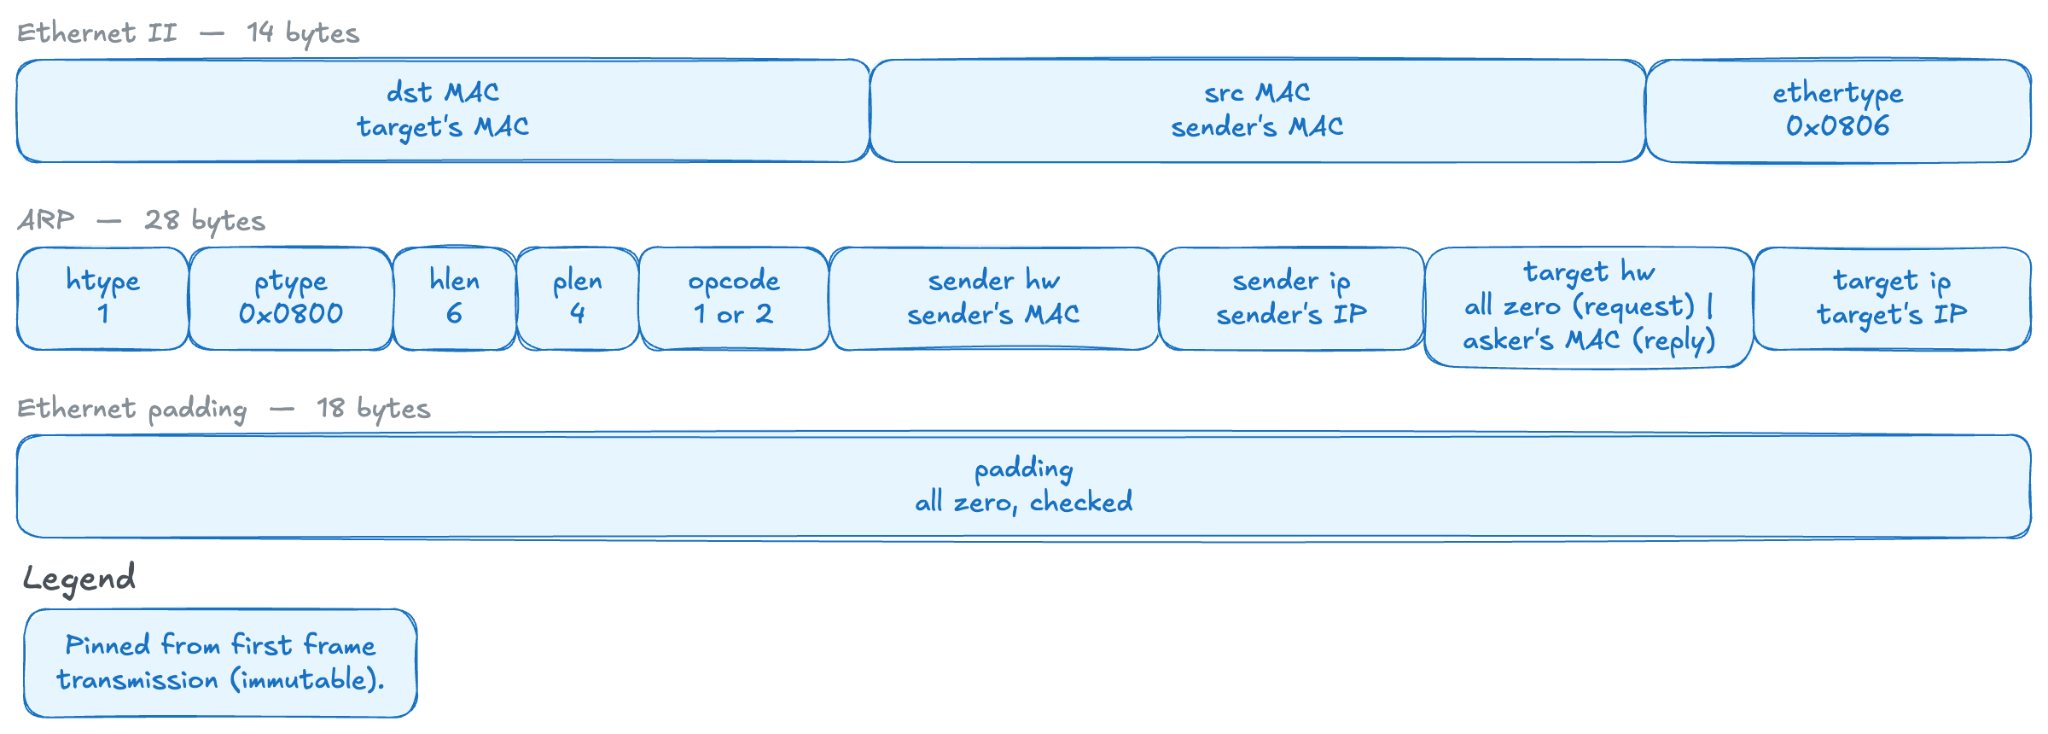
All fields within each ARP frame are pre-determined and validated to be correct by the verifier. In particular we:
- Ensure all padding bits at the end of the Ethernet frame are zero.
- Ensure the target hardware address field is not used (i.e. all bits zero) in an ARP request.
A list of expected allowed destination/source MAC addresses (e.g. prover frontend and backend MACs) can be configured in the frame processor.
Inference HTTP/1.1 via TCP
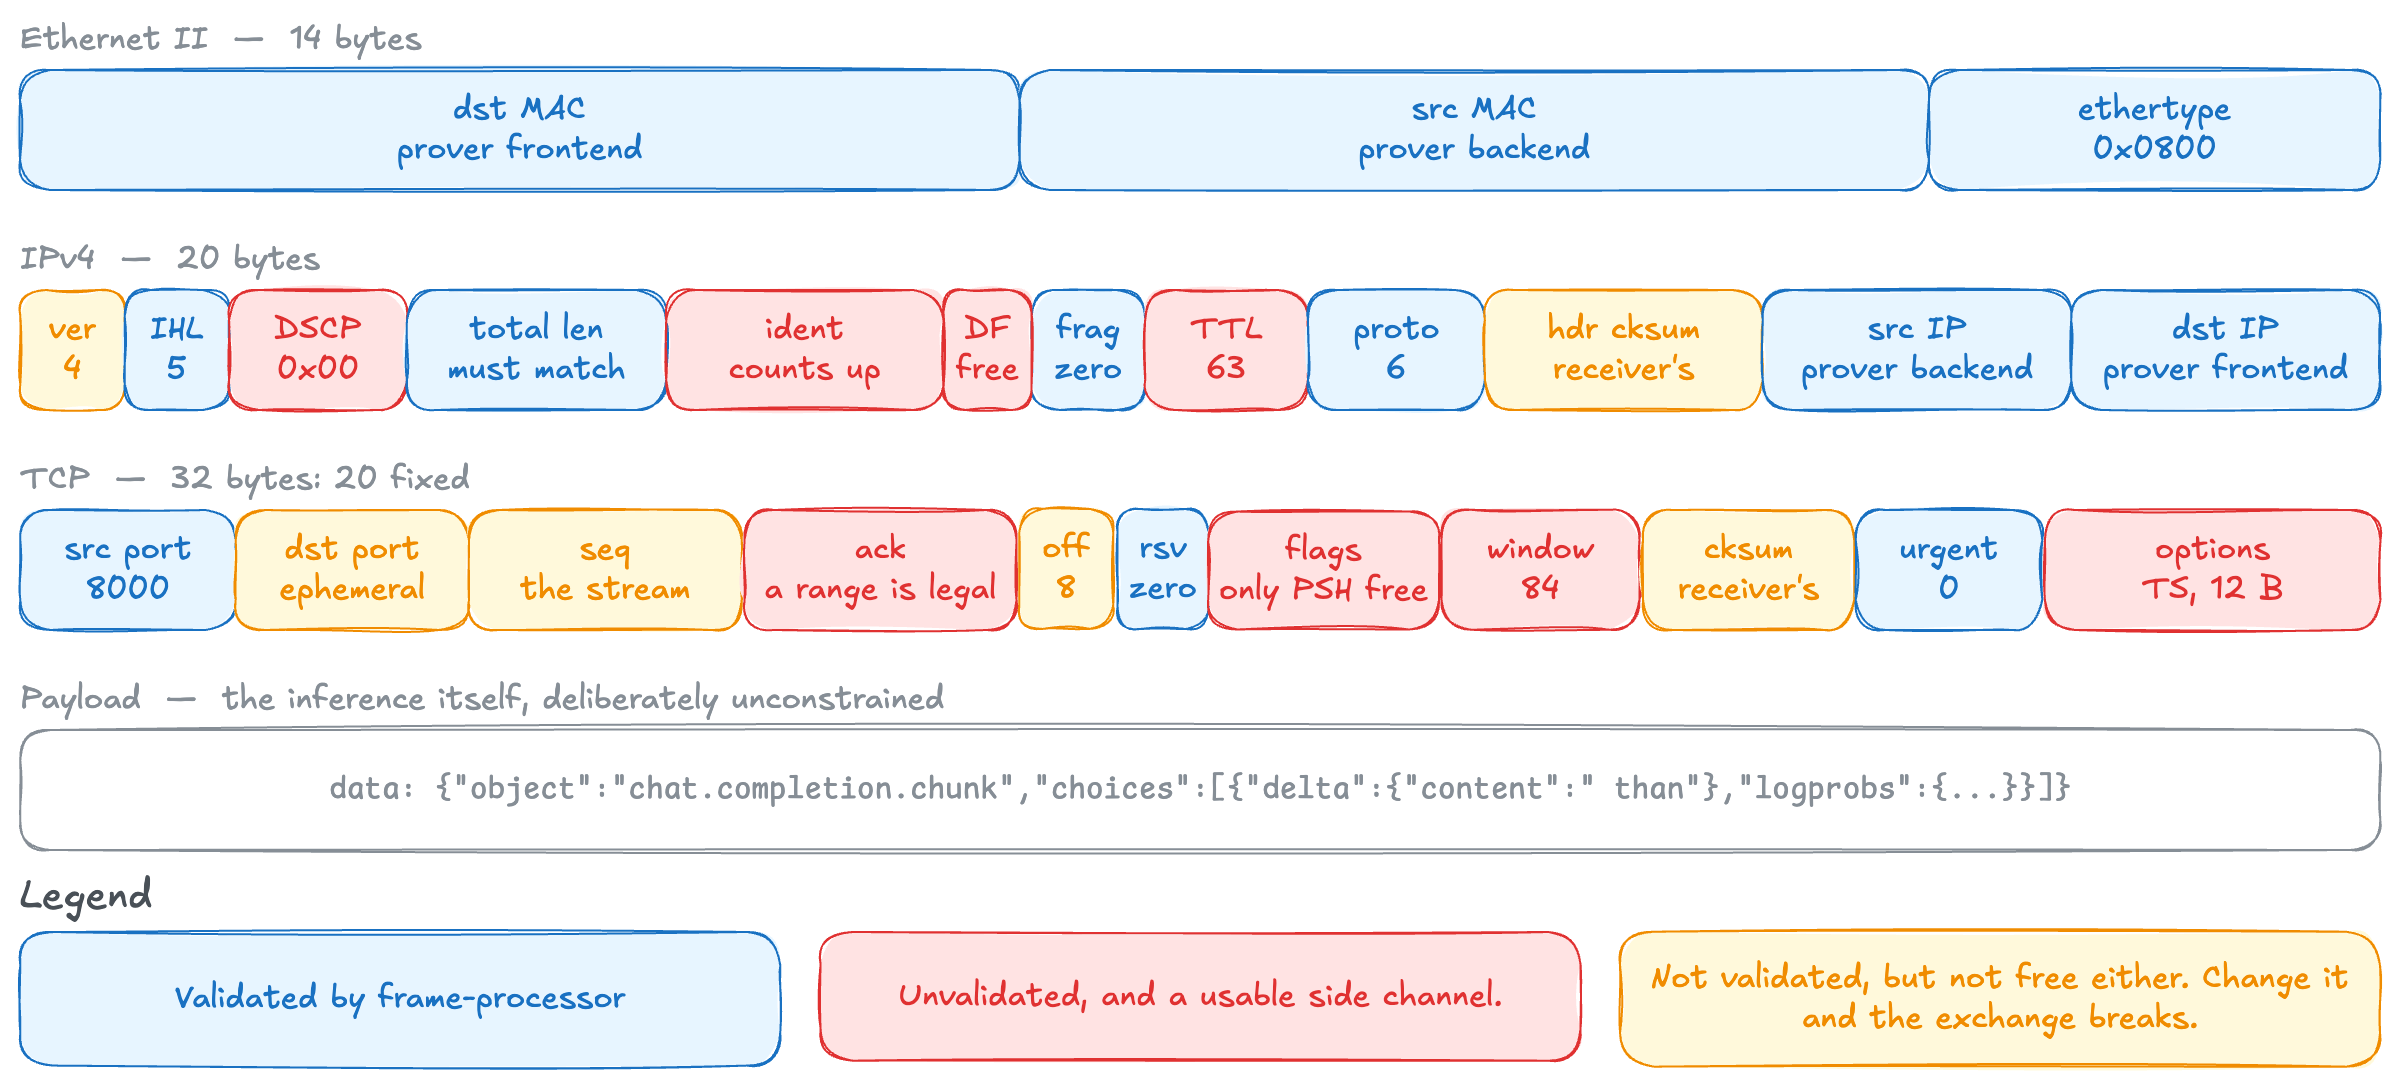
As it contains the inference response, inference TCP cannot be static: its payload differs in every segment. 36 of the 66 header bytes in a frame can be constrained by validating the MAC address, IP address, EtherType and more (see Appendix D).
Technical note: “segments” here are units of TCP data carried within a packet (OSI layer 4).
Reconstruction
At this point, the frame processor holds a stream of individual TCP segments pulled from the frames that passed the whitelist.
These individual segments are not yet usable: a single inference HTTP message is split across many segments, and segments belonging to different connections may arrive out of order.
We need to reconstruct these segments into the respective TCP connection that contains an HTTP inference request the prover frontend sent, and the HTTP responses the prover backend provides. Only then can we pass on an inference exchange for verification.
The frame processor reconstructs a connection by:
- Reassembling segments into one direction of a TCP connection (e.g. the request path)
- Pairing two reassembled directions into one TCP connection (e.g. pairing the request and response streams)
- Determining the client by checking who initiated the connection (i.e. who sent the first TCP segment?)
Technical note: if our capture begins after a connection is already open, there is no TCP handshake to read. In this case, we treat whichever side we saw first as the client.
A TCP connection is finished when both directions have seen a FIN or an RST flag, and there is no missing data. A completed connection should yield valid inference request and response JSON data sent via HTTP.
Note: since a passive TAP cannot request retries, frames can be permanently lost. We implement a timeout to ensure that missed end-of-sequence frames don’t leave the reconstructor waiting forever.
If a frame cannot be reconstructed into a valid inference request, this is logged as non-compliance.
In our implementation the API serving inference is an OpenAI-compatible HTTP endpoint. We check that traffic consists of:
- POST messages to
/v1/chat/completionsor/v1/completions- Carrying a JSON body, answered by a JSON response.
- We have also allowed exemptions for the OpenAI API endpoints
/health,/v1/models,/metricsand/ping.
We then validate that the contents of the messages have the required JSON content and the “model” field identifying the model requested. Once identified, the tapped requests and responses are forwarded for verification (our previous post describes how we verify).
Hardware
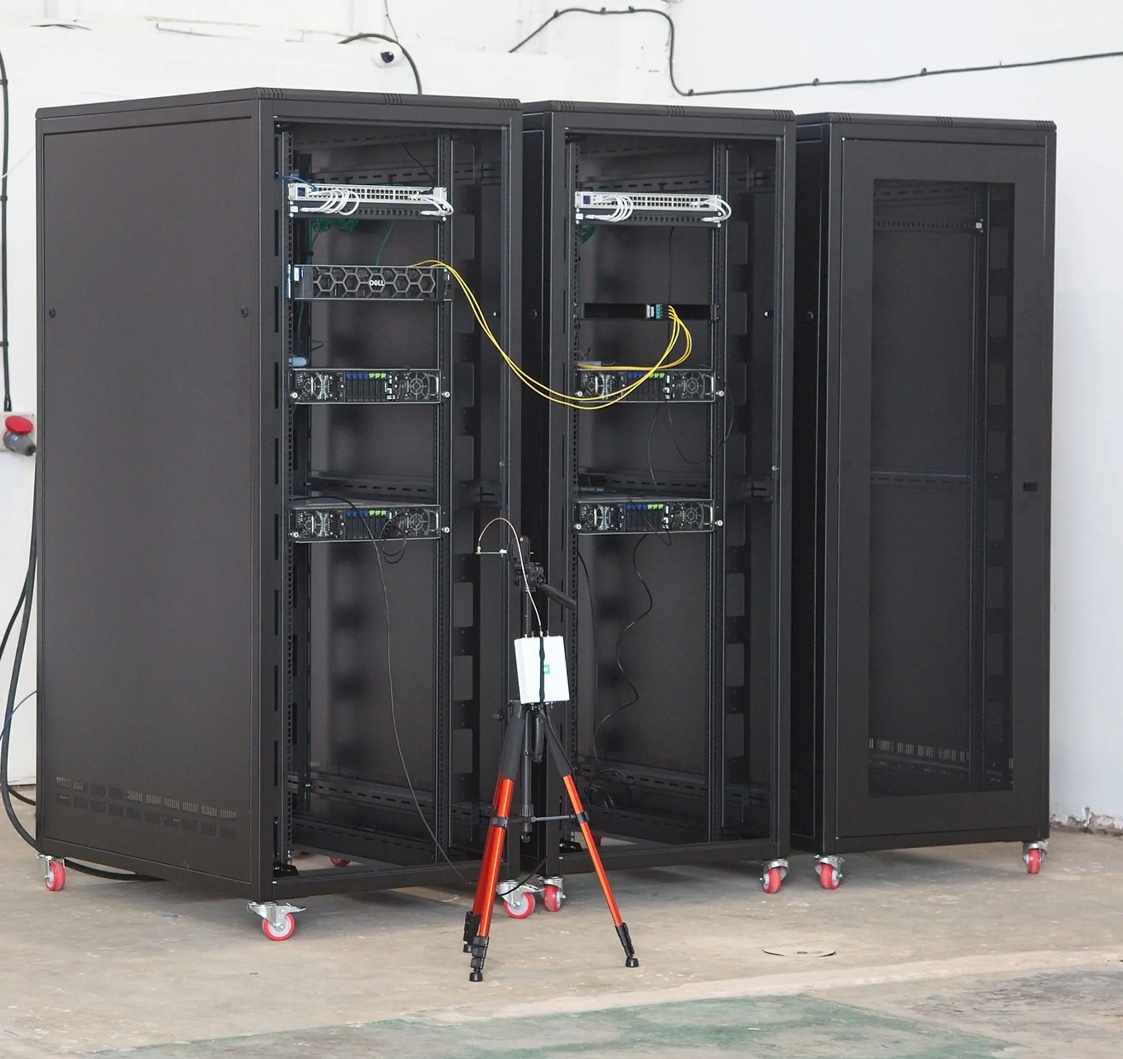
For our physical setup, we used the same server as the prover frontend and verifier. This would not be the case in a real deployment. See the appendix in our previous post for server details.
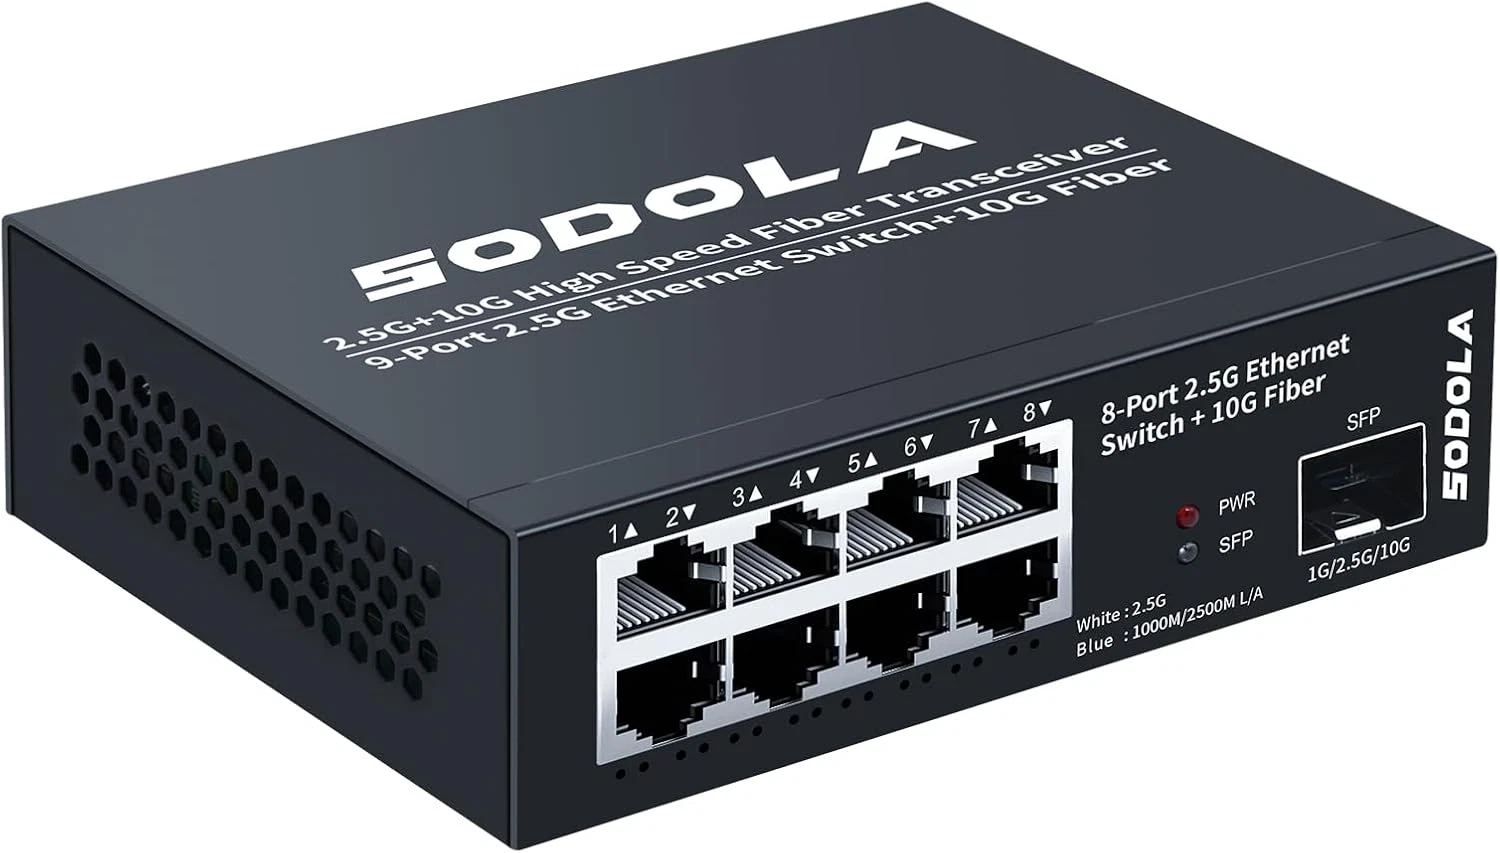
We used a 2×LC multimode bidirectional passive splitter (OM4) fibre TAP (see our previous post on network TAPs) and an unmanaged SODOLA switch to convert between fibre and Ethernet links.
Our prover backend runs a stripped-down Ubuntu image, serving inference from vLLM, and sits on an isolated network with exactly one neighbour.
There is no other uplink; all traffic entering and leaving the backend must pass through the frontend/verifier, and thus must pass through the optical TAP.
Parallelism
The implementation should be able to handle multiple concurrent (i.e. parallel) prompts. To parallelise, we split the work by the nature of the bottleneck:
- Work that waits gets threads (I/O bound). Threads take turns within a process, so they only help when work is blocked rather than computing. This applies to POSTing finished messages to the message writer, which waits on the network.
- Work that computes gets processes (CPU bound). Walking headers, reassembling TCP, parsing HTTP, and filtering are all computation, and need true parallelism across processes.
Both directions of a TCP connection must arrive at the same worker, since a request and response have to be paired. This can be accomplished by hashing the connection’s two endpoints without regard to order (i.e. both directions of a connection have the same hash), so a frame travelling either way yields the same worker index.
Technical note: the hash is BLAKE2s rather than Python’s built-in hash, which is randomised independently in each spawned process. Using the built-in hash would send the two directions of a connection to different flow workers.
Performance testing
Every frame from a tapped link will be filtered and processed in some way by the frame processor; the tapped link will not contain only inference traffic. Also, a passive TAP cannot request frames to be resent, meaning if a frame is lost on the verifier side, it is lost forever.
The requirements
The TAP is sufficiently “performant” if it can successfully:
- Identify, reconstruct, and send inference events to the message writer whilst the server is receiving traffic at near its link’s maximum rate (in our case the 1 Gbps uplink on the verification server).
- In the event a frame is lost and/or an inference request/response is incomplete, show a warning log on the verification server.
We expect our verification system to be more sensitive to packet transfer rates (packets per second) than to data throughput (bytes per second), as each frame needs to be individually filtered, processed, etc.
The tests we ran
We stress tested the performance of the TAP by:
- Flooding the tapped network with irrelevant TCP/UDP data using iperf3.
- Scheduling many inference prompts that are received in parallel.
We generated synthetic data and sent:
- ~1 Gbps of non-whitelisted TCP traffic at a rate of 103 kpps (kilopackets per second). This non-whitelisted traffic was also subsequently logged.
- A batch of 800 inference requests with a concurrency of 32 (sent in parallel) on the network.
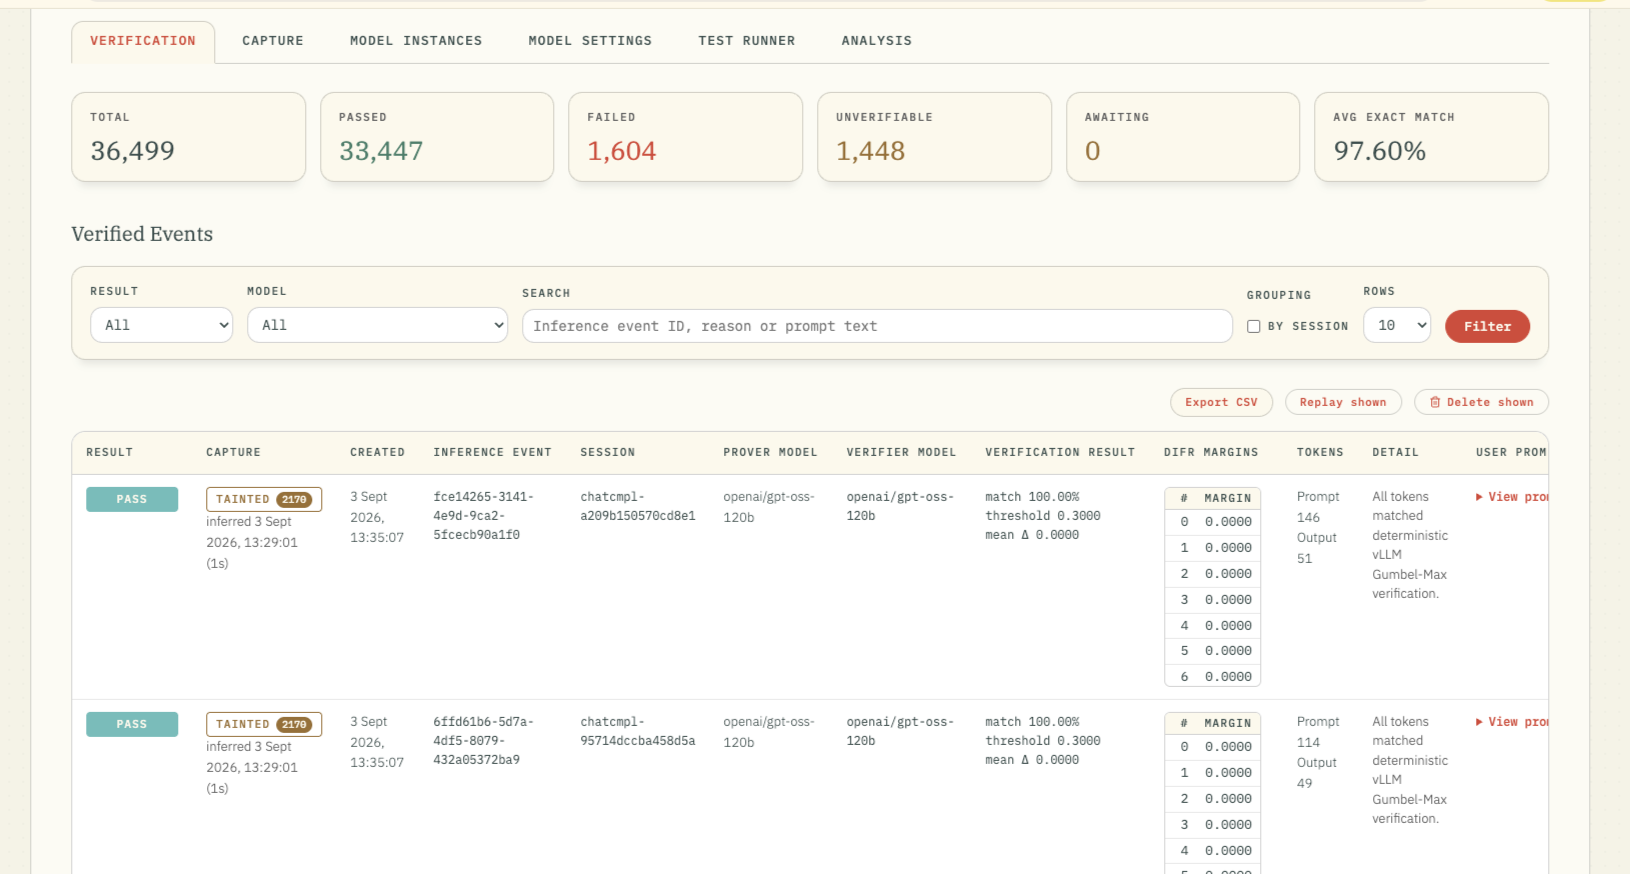
All 800 inferences were tapped and sent to the message writer for verification during the flood, and subsequently verified successfully.
Additionally, the frame processor handled a separate test of 1 Gbps of UDP traffic at ~800 kpps with no issue; all 800 prompts running at a concurrency of 32 were tapped and verified. See Figure 10 for a screenshot of the logs of the TCP flood test.
Relevant timestamps (see the monitor window on the right in Figure 10):
- 10:14:54 TCP flood starts
- 10:15:16 batched inference events start (800 prompts, 32 concurrency)
- 10:16:39 batched inference events complete
- 10:16:51 TCP flood ends
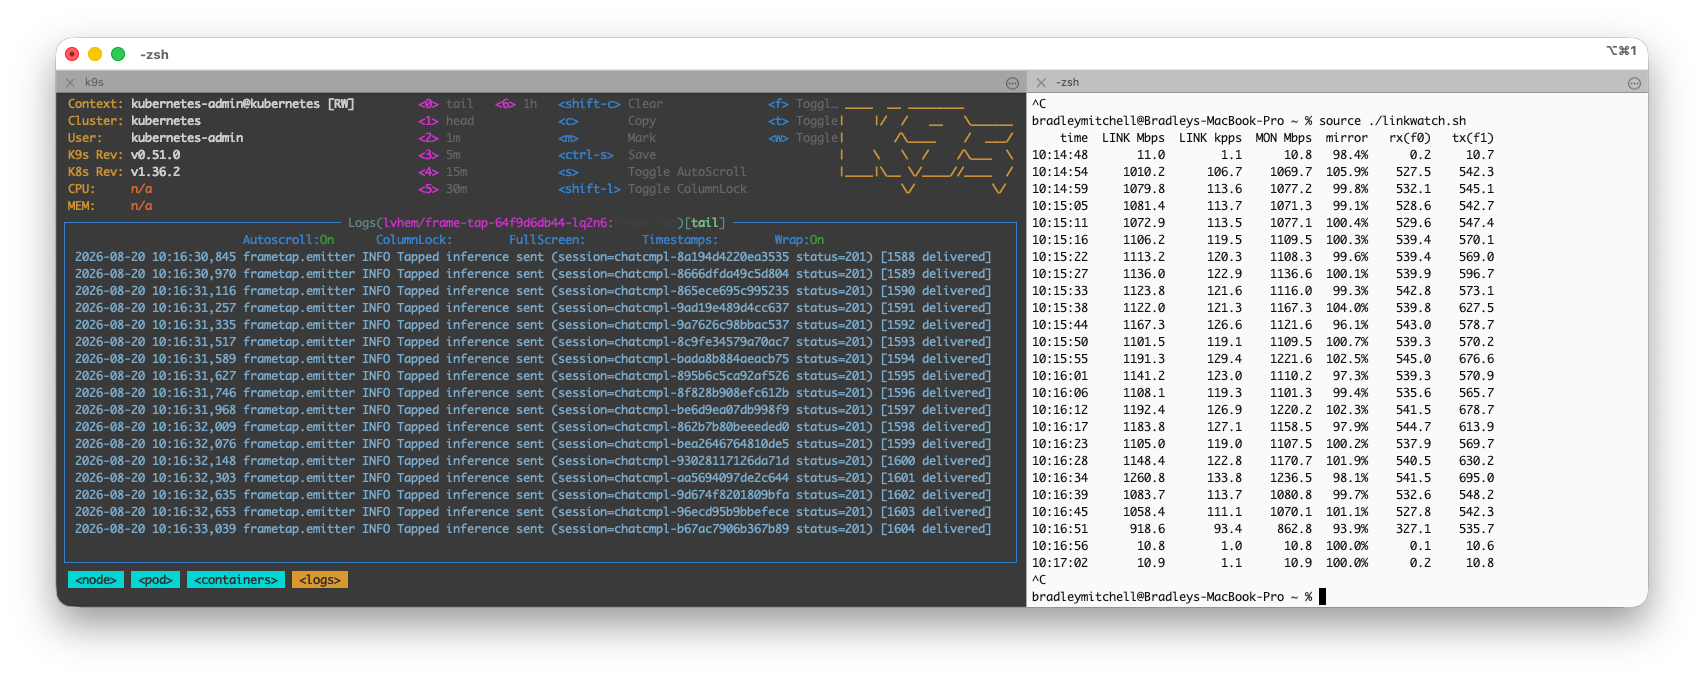
This shows that our implementation is sufficiently performant for our setup.
There are other possible avenues for getting greater performance if needed, for example if the verifier had to accumulate traffic from multiple TAPs from multiple provers:
- Optimising the code (especially moving to a compiled language such as Rust or C++) could yield greater performance.
- Offloading some of the capturing, filtering and reassembly work away from the software, such as DPU offloading onto a BlueField-3 NIC.
Summary and further work
Inference events can be collected by passively watching a network link. The TAP can read both directions of the tapped link, reconstruct the HTTP messages from the frames, identify inference traffic by content inspection, and then forward inference traffic to the recomputation system.
Testing showed this solution is performant in our setup. The processor software successfully reports lost frames and connections.
We characterised the remaining side channels in our system, where a prover could attempt to silently hide illicit traffic, and are confident that these can be further mitigated.
Further work
- Quantifying possible side channels: There remain some open side channels in our implementation (noted inline in the text). Further modifications would quantify the impact of these side channels.
- Build an active TAP: To close these side channels we will build an active TAP that enforces a communication contract with the inference provider (see our explanation).
- Encryption: This prototype assumes that inference traffic is unencrypted HTTP/1.1 aligned with OpenAI-compatible endpoints. Encryption would prevent frame processing entirely. We could use a shared key to decrypt the tapped traffic.
- More sophisticated inference validation: Rather than using the OpenAI-compatible endpoints and assuming all traffic within is correct, we could analyse the structure and contents of the HTTP streams to ensure that inference is not hidden within the JSON body in unchecked/unexpected fields.
- Large-scale considerations: A real data centre with many provers may require a longer whitelist of necessary traffic on each link, as statically defining IPs and MAC addresses etc. may not be ideal at scale. We have noted some of the extra protocols we expect may be needed in this scenario alongside their side channels in Appendix E.
- Health checks: Our bespoke health checks do not encode information about server health or configuration, to avoid side channel opportunities. This is likely to be desired in a real data centre and should be explored/extended.
- Zero-knowledge: We are working on a ZK inference verification system to replace DiFR. We may have to modify some of this work in the future to support this new system.
Appendix A: Handling findings
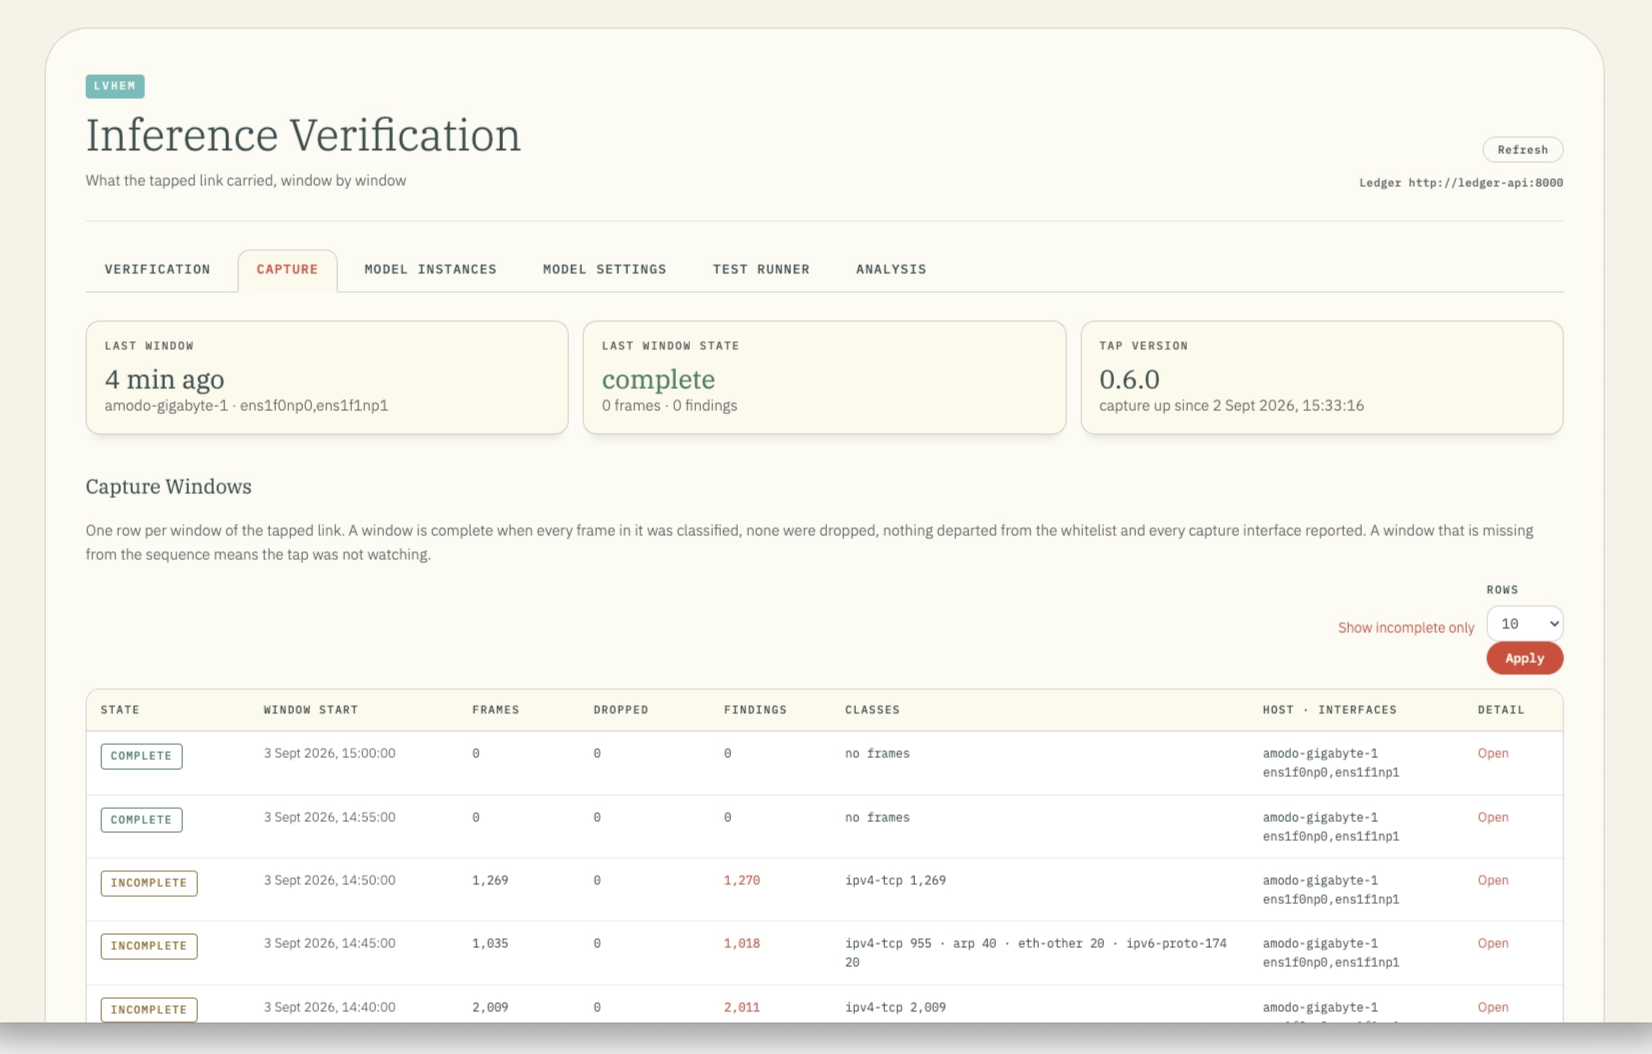
Findings are recorded in the ledger from our previous prototype. A capture window table contains an entry per five minutes of wall-clock time for each link direction (inbound and outbound traffic). Each entry is a summary of:
- How many frames were observed.
- How many frames were classified.
- How many frames the kernel dropped.
- A count summary per reason the frame was rejected.
- A single
completeflag denoting whether every frame in the window is whitelisted and accounted for.
Each row has a count, first and last timestamps, and a few sampled frames. We count because logging each individual flagged frame would require storing unbounded amounts of data.
Appendix B: Issues during development
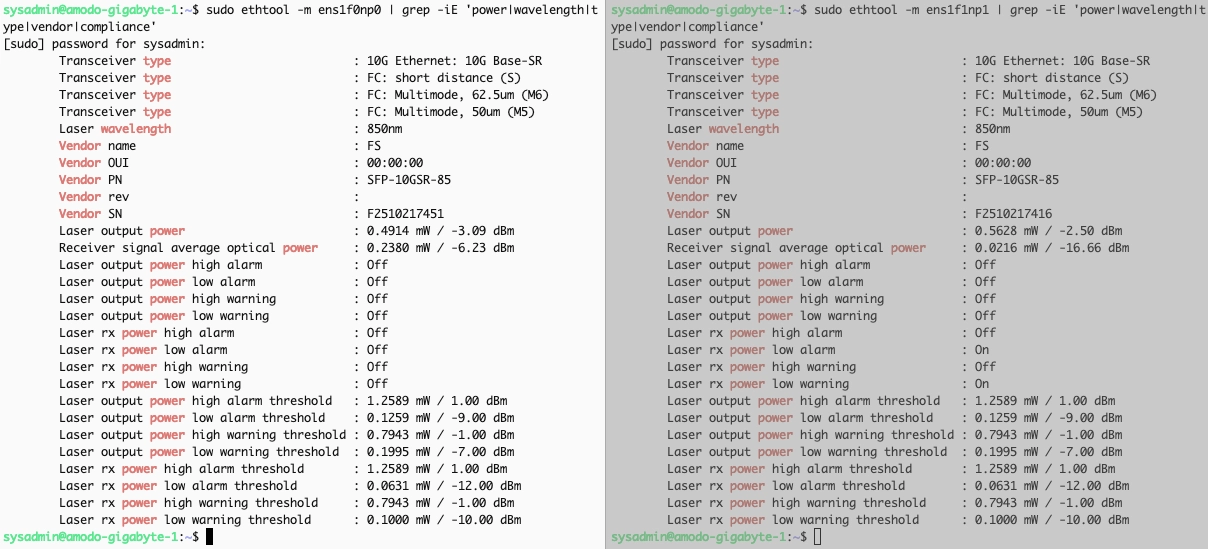
Optical TAP issues. Initially, almost every frame we captured was corrupt and reported a Cyclic Redundancy Check (CRC) error.
This was due to weak optical power input caused by a dirty fibre optic cable. After cleaning the tip of every cable with isopropyl alcohol and a lint-free cloth, the issue was resolved. Figure 13 shows the transceiver diagnostics in each monitor port used to find this.
Our previous network tapping article describes how our optical TAP splits inbound light so some is diverted to the verifier, and the rest continues on its original path. This makes this system in particular susceptible to the issue of weak optical power.
Mangled frames. Inference requests were successfully tapped and reconstructed, but inference responses came out mangled and unreadable.
This was due to the Linux kernel coalescing many Ethernet frame segments into one large frame without updating higher-level length headers (e.g. IPv4 total length). The packet was larger than stated, and the parser was therefore only reading a partial amount of a full frame.
The fix was to stop trusting the declared lengths and take the frame’s own size instead.
Performance degradation. Earlier versions of the frame processor also had degraded performance the longer the TAP ran. A passive TAP has no recourse to regain lost frames, so the buffer of pending frames in a TCP connection continually grows.
Additionally, we checked the whole pending buffer against each received frame, which caused slowdowns and snowballed into more lost frames.
To mitigate these issues, we:
- Capped the frame buffer at 2 MB, and flush it past this size. This leads to a TCP connection being permanently lost, and is logged.
- Only check against the pending set if the received frame is equal to the next expected segment number.
Removing the inference proxy. The inference proxy enforced the returning of the token IDs and the logits, which is necessary for our inference verification system.
We now perform this operation within the functions section in the admin panel of Open WebUI. The function used for injecting token IDs into a request can be seen below.
from pydantic import BaseModel, Field
from typing import Optional


class Filter:
    async def inlet(self, body: dict, __user__: dict = None) -> dict:
        body["return_token_ids"] = True
        return body
Appendix C: Decapsulating UDP datagrams to check for potential TCP connections
Before isolating the prover backend, the server was set up as a Kubernetes cluster using Flannel as its CNI (Container Network Interface).
Flannel is responsible for handling traffic between pods, including those that run on different nodes. Part of this entails encapsulating pod traffic in UDP when passing between nodes over the physical network (see VXLAN).
This meant that the tapped link saw all TCP inference traffic encapsulated within a UDP datagram during transit between node boundaries (prover frontend ⇄ prover backend), preventing us from reassembling inference events.
To view the contents of inter-node traffic, we included a decapsulating stage in the decoding with the following steps:
- Check if a UDP datagram arrives on a port we expect VXLAN traffic on (4789 is the IANA assignment, and 8472 is the port Flannel actually uses)
- Strip the VXLAN header
- Decode and identify the inner contents as you would with any other received frame.
Appendix D: Side channel analysis
In our implementation, there are a few remaining identifiable side channels within the whitelisted traffic (health check, ARP, inference TCP).
We have broken down each field in the whitelisted traffic, stating whether it is validated or not, and possible side-channel opportunities where relevant.
Health check
| Layer | Offset | Bytes | Field | Validation |
|---|---|---|---|---|
| Ethernet/IPv4 | 0:34 | 34 | – | Same approach as taken in the Inference TCP table (see below). |
| UDP | 34 | 2 | Source port | Must remain the same value as what was sent in the first frame (e.g. 9999) |
| UDP | 36 | 2 | Destination port | Must remain the same value as what was sent in the first frame (e.g. 9999) |
| UDP | 38 | 2 | Length | Must remain the same value as what was sent in the first frame. |
| UDP | 40 | 2 | Checksum | Must remain constant (payload in each direction is constant, so checksum should also be constant). |
| UDP | 42:73 | 31 | Payload | Must remain constant (e.g. LVHEM-TAPPED-LINK-HEALTH/1 REQ\n for prover backend → prover frontend) |
| – | – | – | Frequency | Must arrive every 30 s ± 5 s. Missed or early health checks are reported as findings. |
Table 2. Field-by-field validation of the health check frame.
ARP
| Layer | Offset | Bytes | Field | Validation |
|---|---|---|---|---|
| Ethernet | 0 | 6 | Destination | Must match the MAC address of the monitored port (e.g. on amodo-gigabyte-2 → amodo-gigabyte-1, 10:ff:e0:af:45:a8) |
| Ethernet | 6 | 6 | Source | Must match the MAC address of the monitored port (e.g. on amodo-gigabyte-2 → amodo-gigabyte-1, 8c:91:3a:d6:08:be) |
| Ethernet | 12 | 2 | EtherType | Must match classified type, in this case ARP (0x0806) |
| ARP | 14 | 2 | Hardware type | Must be Ethernet (0x0001) |
| ARP | 16 | 2 | Protocol type | Must be IPv4 (0x0800) |
| ARP | 18 | 1 | Hardware address length | Must be 6 (0x06) |
| ARP | 19 | 1 | Protocol address length | Must be 4 (0x04) |
| ARP | 20 | 2 | Opcode | Must be a request or a reply (0x0001 or 0x0002) |
| ARP | 22 | 6 | Sender MAC address | Must equal Ethernet source at offset 6. |
| ARP | 28 | 4 | Sender IP address | Direction dependent (amodo-gigabyte-2 → amodo-gigabyte-1: 192.168.60.2) |
| ARP | 32 | 6 | Target MAC address | On request, must be all zeros. On reply, must equal Ethernet destination at offset 0. |
| ARP | 38 | 4 | Target IP address | Direction dependent (amodo-gigabyte-2 → amodo-gigabyte-1: 192.168.60.1) |
| Ethernet | 42:60 | 18 | Padding | Every byte must be zero |
Table 3. Field-by-field validation of ARP frames.
Inference TCP
| Layer | Offset | Bytes | Field | Validation |
|---|---|---|---|---|
| Ethernet | 0 | 6 | Destination | Must match direction of monitored port (e.g. on amodo-gigabyte-2 → amodo-gigabyte-1, 10:ff:e0:af:45:a8) |
| Ethernet | 6 | 6 | Source | Must match the MAC address of the monitored port (e.g. on amodo-gigabyte-2 → amodo-gigabyte-1, 8c:91:3a:d6:08:be) |
| Ethernet | 12 | 2 | EtherType | Must match classified type, in this case IPv4 (0x0800) |
| IPv4 | 14 | ½ | IP version | Unchecked, but packet discarded if incorrect. |
| IPv4 | 14 | ½ | IP header length | Must declare no options (so header length = 5). |
| IPv4 | 15 | 1 | Differentiated Services Field/ECN | Unchecked, could possibly ensure to be 0x00 |
| IPv4 | 16 | 2 | Total length | Must be the frame’s real length |
| IPv4 | 18 | 2 | Identification | Varies by design (65,536 values, assigned by kernel). |
| IPv4 | 20 | 2 | Flags/fragment | The reserved bit, more fragments bit, and 13-bit fragment offset must all be zero. Don’t fragment bit is unchecked. |
| IPv4 | 22 | 1 | TTL | Unchecked. Could this be statically set? |
| IPv4 | 23 | 1 | Protocol | Implied by classification (in this case must be TCP 0x06) |
| IPv4 | 24 | 2 | Header checksum | Unvalidated, could be derived and checked. Incorrect value leads to packet being discarded. |
| IPv4 | 26 | 4 | Source address | Direction dependent (e.g. in amodo-gigabyte-2 → amodo-gigabyte-1 must be 192.168.60.2) |
| IPv4 | 30 | 4 | Destination address | Direction dependent (e.g. in amodo-gigabyte-2 → amodo-gigabyte-1 must be 192.168.60.1) |
| TCP | 34 | 2 | Source port | Must be 0x1f40 (can only serve port 8000) (prover backend → prover frontend) |
| TCP | 36 | 2 | Destination port | In prover backend → prover frontend, this is not strictly validated but repeats the request’s port. Changing this would break the protocol regardless. |
| TCP | 38 | 4 | Sequence number | Not validated. Initial sequence number is unverifiable, but subsequent numbers may be. |
| TCP | 42 | 4 | Ack number | Not validated |
| TCP | 46 | ½ | Data offset | Must be between 5 and 15 (observed 8 and 10: 32-byte header on data segments, 40 on handshakes). Every legal value between 5 and 15 is accepted and unvalidated. |
| TCP | 46 | ½ | Reserved | All four bits must be zero |
| TCP | 47 | 1 | Flags | Any, except a bare SYN from amodo-gigabyte-2 (should only ever answer connections, not solicit). The others are unchecked but varying these would break the TCP connection. The only free bit is PSH. |
| TCP | 48 | 2 | Window | Free, varies |
| TCP | 50 | 2 | Checksum | Unvalidated, could be derived and checked |
| TCP | 52 | 2 | Urgent pointer | Must be zero when URG is clear |
| TCP | 54 | 12 | Options composition | Free, varies. It may be possible to make this static. |
| TCP | 66: | ? | Payload | Not validated, handled elsewhere. Must be a parseable inference HTTP exchange at a permitted endpoint. |
Table 4. Field-by-field validation of inference TCP frames.
| Unvalidated field | Bits | Free | Why/why not all bits free? |
|---|---|---|---|
| TCP options | 96 | 64 | The 32-bit timestamp echo merely copies the value the peer sent. |
| Sequence number | 32 | 0 | Deterministic: the previous value plus the bytes sent. Only the initial number is free, and that is chosen once per connection rather than per segment. |
| Acknowledgement | 32 | 11 | Fixed by what actually arrived, apart from the slack in the case of acknowledging fewer bytes than were received. |
| Both checksums | 32 | 0 | A wrong value is only expressible in a frame the far end will discard, so it reaches an observer on the link but not the endpoint. |
| Identification | 16 | 16 | Assigned by the kernel and varies by design. |
| Window | 16 | 8 | Bounded by the receiver’s real buffer. |
| DSCP / ECN | 8 | 8 | Measured as 0x00 on every captured frame; ECN is not negotiated on this connection, but could vary in future. |
| TTL | 8 | 8 | Constant 63 on every captured frame, but could vary in future. |
| Don’t-fragment bit | 1 | 1 | Inside a field we otherwise check (flags/fragment), but nothing requires DF to be set. |
| PSH flag | 1 | 1 | Inside a field we otherwise check (flags), but it changes nothing about delivered data. |
| Total | 242 | 117 |
Table 5. Unvalidated bits in the inference TCP header, and how many of them a prover could actually choose freely.
Appendix E: Out-of-band side channels
This list consists of either side channels that were identified and mitigated with our whitelist, or side channels that were not found in this work but could arise in real data centre or alternative setups.
| Protocol | Why it may arise | Side-channel opportunities |
|---|---|---|
| LLDP | Switches, NICs, etc. advertise their identity to neighbours, typically by default. Initially observed and disabled on our link. | LLDP allows organisationally specific TLVs (type 127). This is an arbitrary payload by design, and can have variable length and payload data, opening a large side channel opportunity. |
| IGMP | Hosts announce multicast group membership. | The 32-bit group address is largely free within 224.0.0.0/4, and could use the lower bits of the address to hold arbitrary data (e.g. 239.X.Y.Z, where X, Y and Z are data bytes). |
| STP | Managed switches continually share BPDUs from designated ports every 2 seconds by default. | BPDUs could be forged so the MAC address does not represent a real switch, but instead holds 6 bytes of arbitrary data. |
| NTP | Time synchronisation. Almost certainly needed in a real deployment. | Four 64-bit timestamps, each carrying a 32-bit fraction that nothing can validate: a long-established covert channel. |
Table 6. Protocols not in our whitelist that may be needed in a real deployment, and the side channels they open.